Mollier Chart H-S Diagram
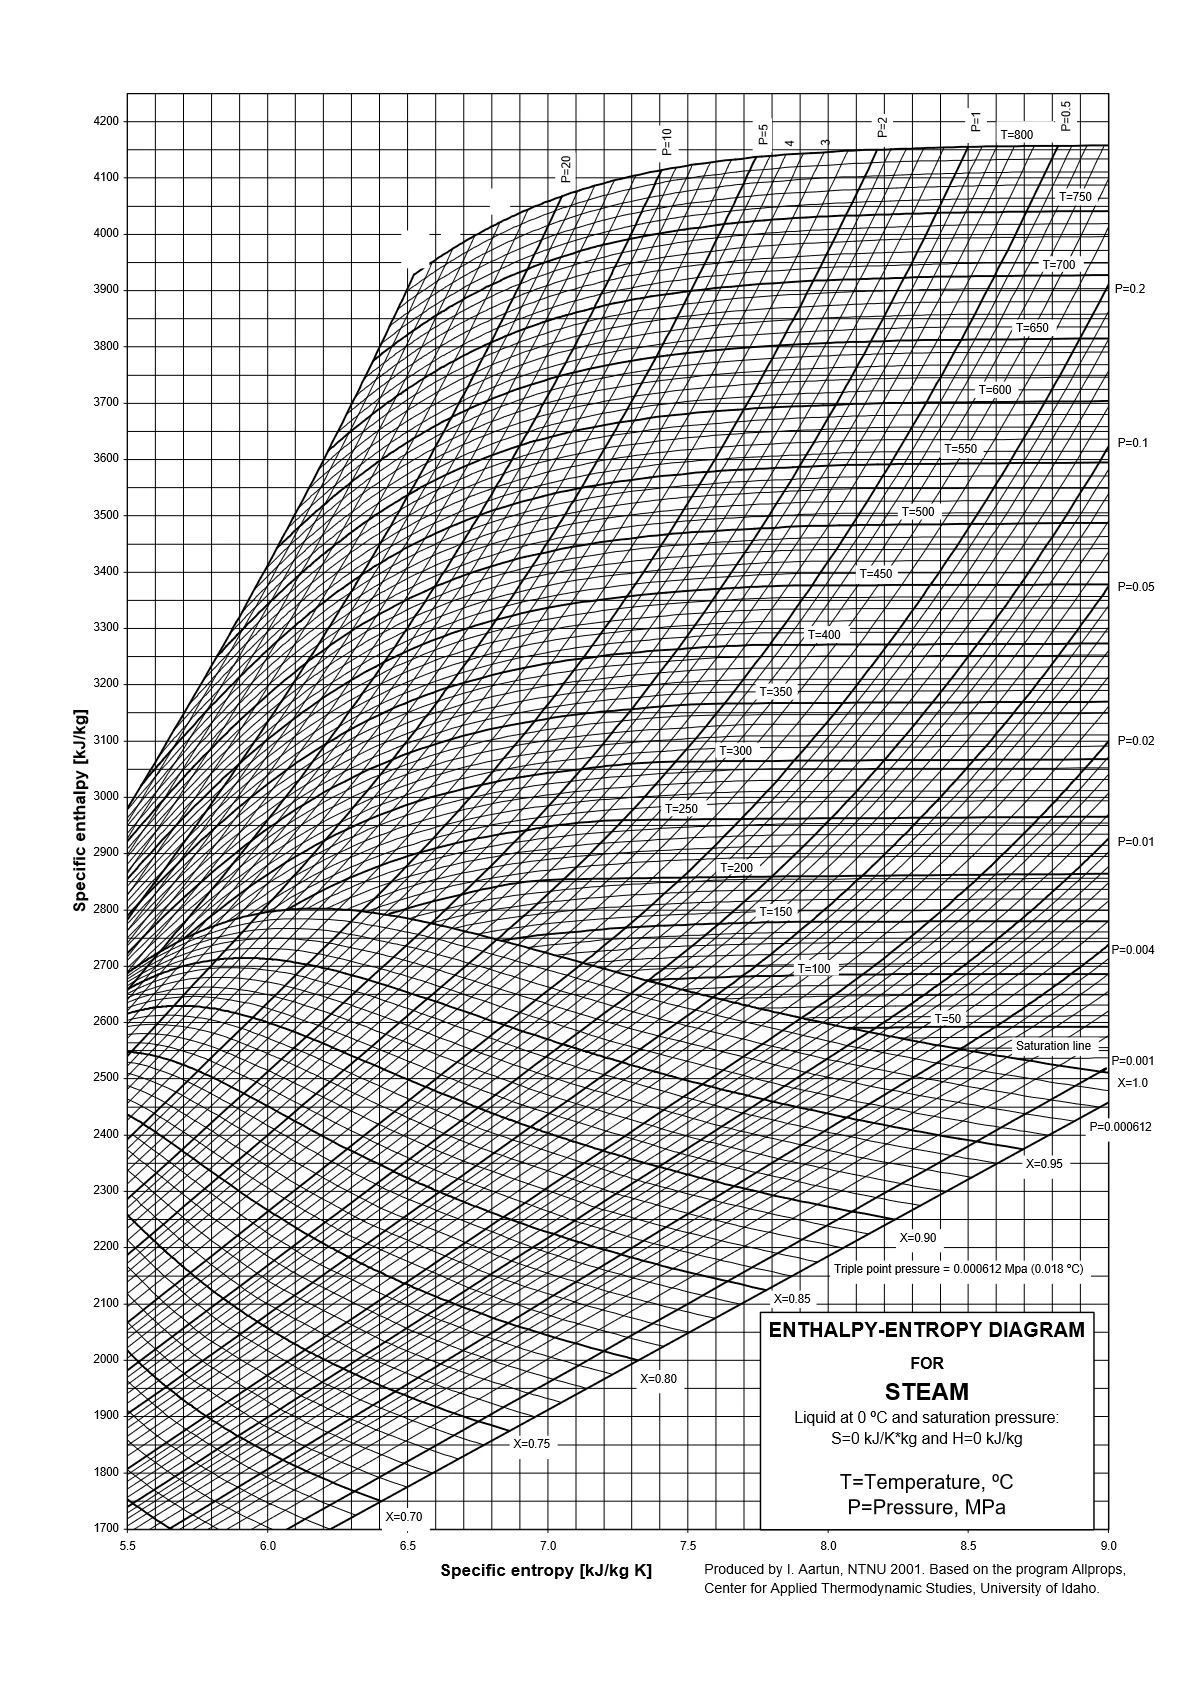
The Mollier Chart, also known as the H-S (Enthalpy-Entropy) diagram, is a graphical representation of thermodynamic properties of substances, particularly steam and other fluids. It’s extensively used in the field of thermodynamics and heat engineering for various applications.
The Mollier Chart is a valuable tool for engineers and thermodynamicists for analyzing, designing, and optimizing various thermal systems and processes, particularly those involving the generation, transfer, and utilization of heat and power.