Trading Chart Pattern & Candlestick Book for Beginners
Candlestick patterns are a form of technical analysis used in trading to identify potential trend reversals, continuations, or indecision in the price movement of a financial asset.
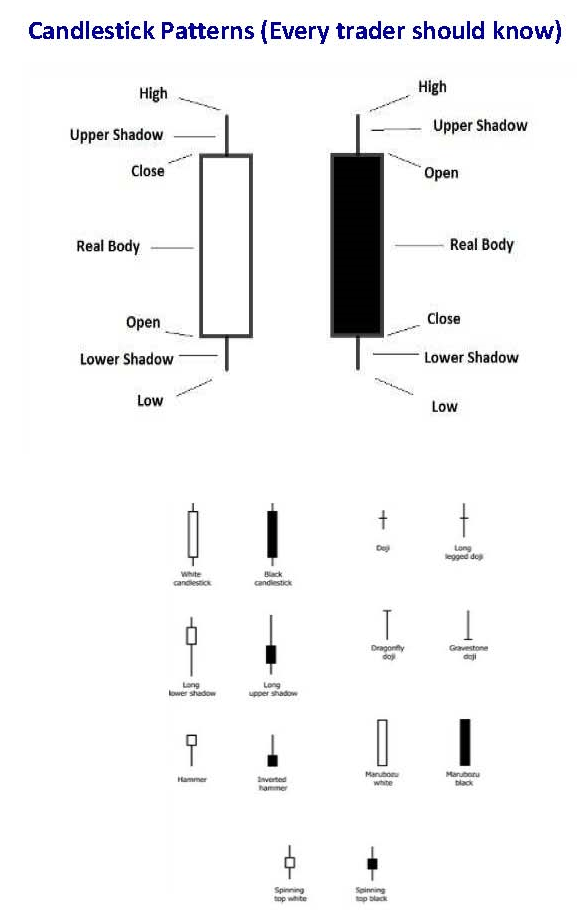
Each candlestick represents a specific period (e.g., 1 minute, 1 hour, 1 day) and provides information about the open, high, low, and close prices during that period.
Common Candlestick Patterns – Brief Descriptions:
- Doji: A doji occurs when the open and close prices are very close to each other, resulting in a very small body. It indicates indecision in the market and can signal a potential reversal.
- Hammer: A hammer candlestick has a small body with a long lower wick and little to no upper wick. It suggests that sellers were initially in control but buyers managed to push the price back up, potentially signaling a bullish reversal.
- Shooting Star: The shooting star is the opposite of a hammer, characterized by a small body with a long upper wick and little to no lower wick. It indicates that buyers initially pushed the price higher but sellers regained control, possibly signaling a bearish reversal.
- Engulfing Pattern: This pattern consists of two candlesticks where the body of the second candle completely engulfs the body of the first candle. A bullish engulfing pattern forms at the bottom of a downtrend and suggests a potential reversal to the upside, while a bearish engulfing pattern at the top of an uptrend suggests a potential reversal to the downside.
- Morning Star / Evening Star: These are three-candle reversal patterns. The morning star consists of a long bearish candle, followed by a small-bodied candle (could be bullish or bearish) that gaps down, and then a long bullish candle. It suggests a potential bullish reversal. The evening star is the opposite, signaling a potential bearish reversal.
- Harami: A harami pattern consists of two candlesticks where the body of the second candle is contained within the body of the first candle. It suggests a potential reversal, but traders often wait for confirmation before taking action.
- Dark Cloud Cover / Piercing Line: These are two-candle reversal patterns. The dark cloud cover occurs in an uptrend when a bearish candlestick follows a bullish candlestick and opens above the previous close but closes below the midpoint of the previous candle. It suggests a potential bearish reversal. The piercing line is the opposite, occurring in a downtrend and suggesting a potential bullish reversal.
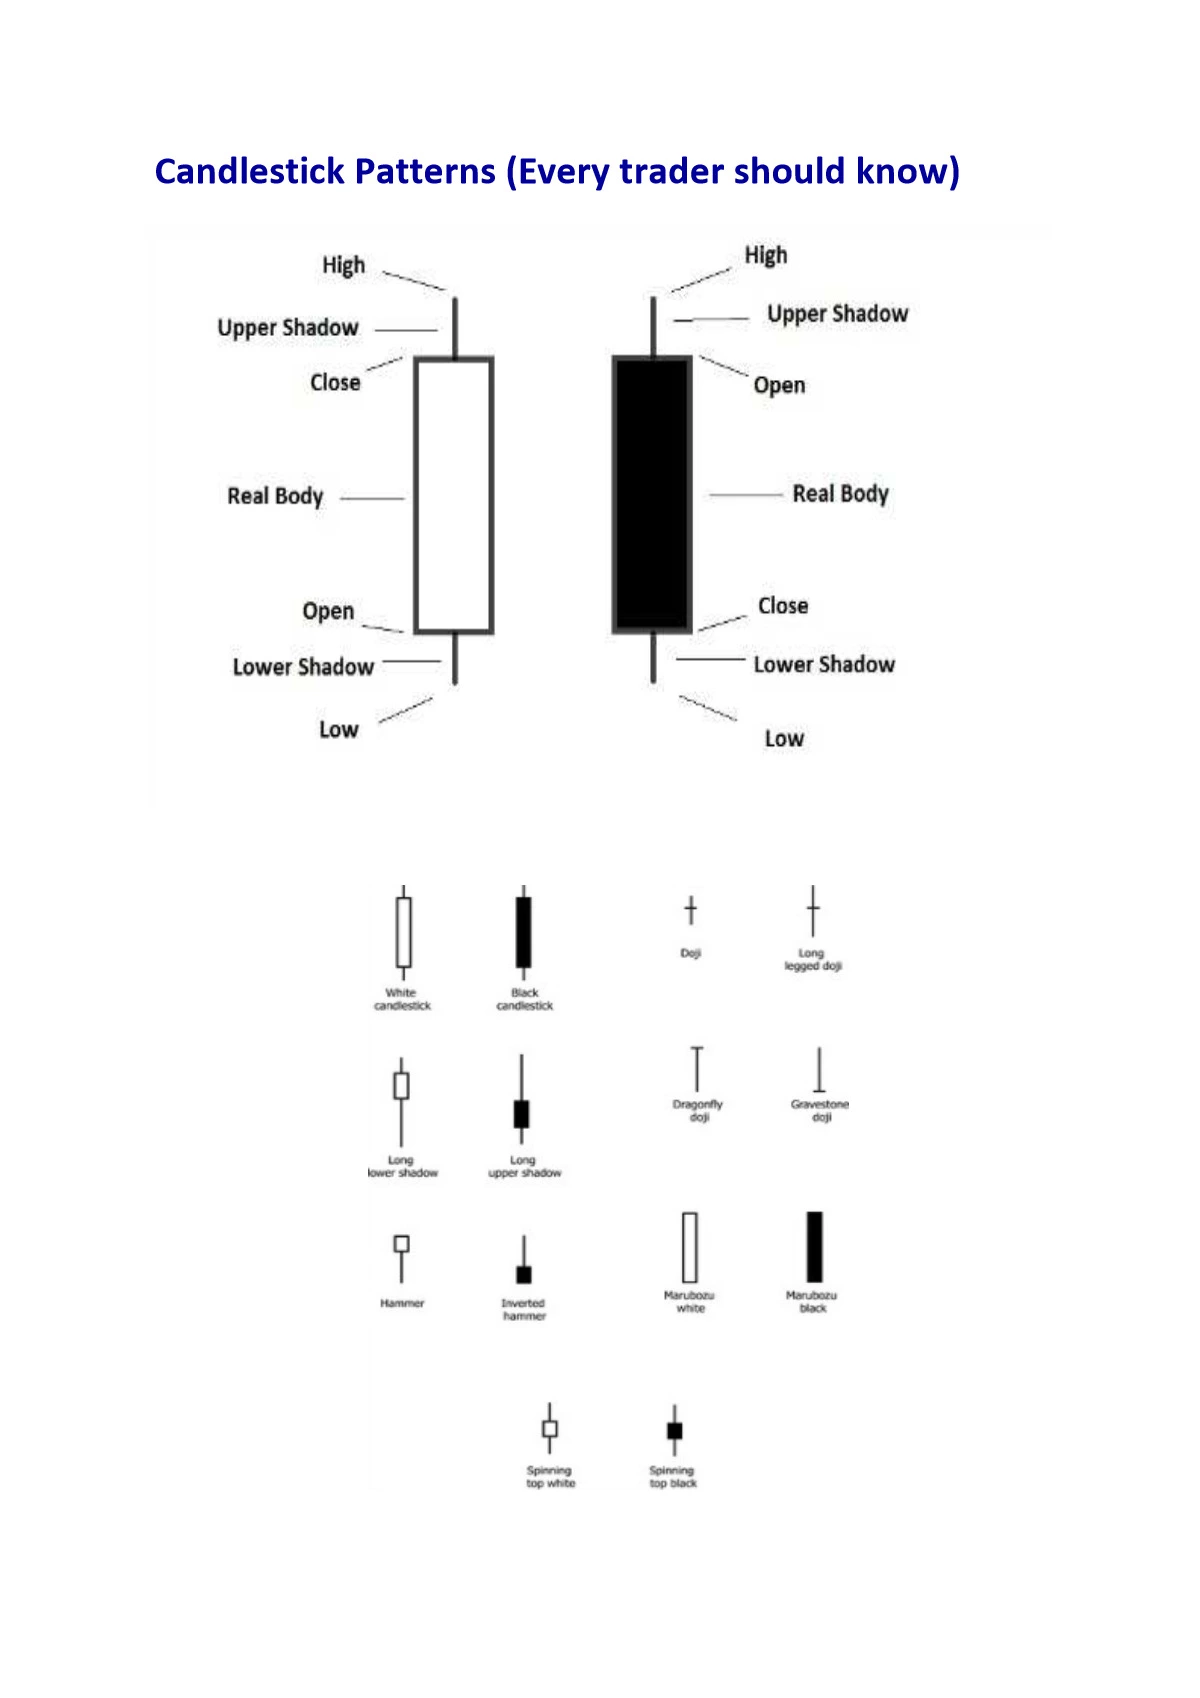
Candlestick Pattern Chart