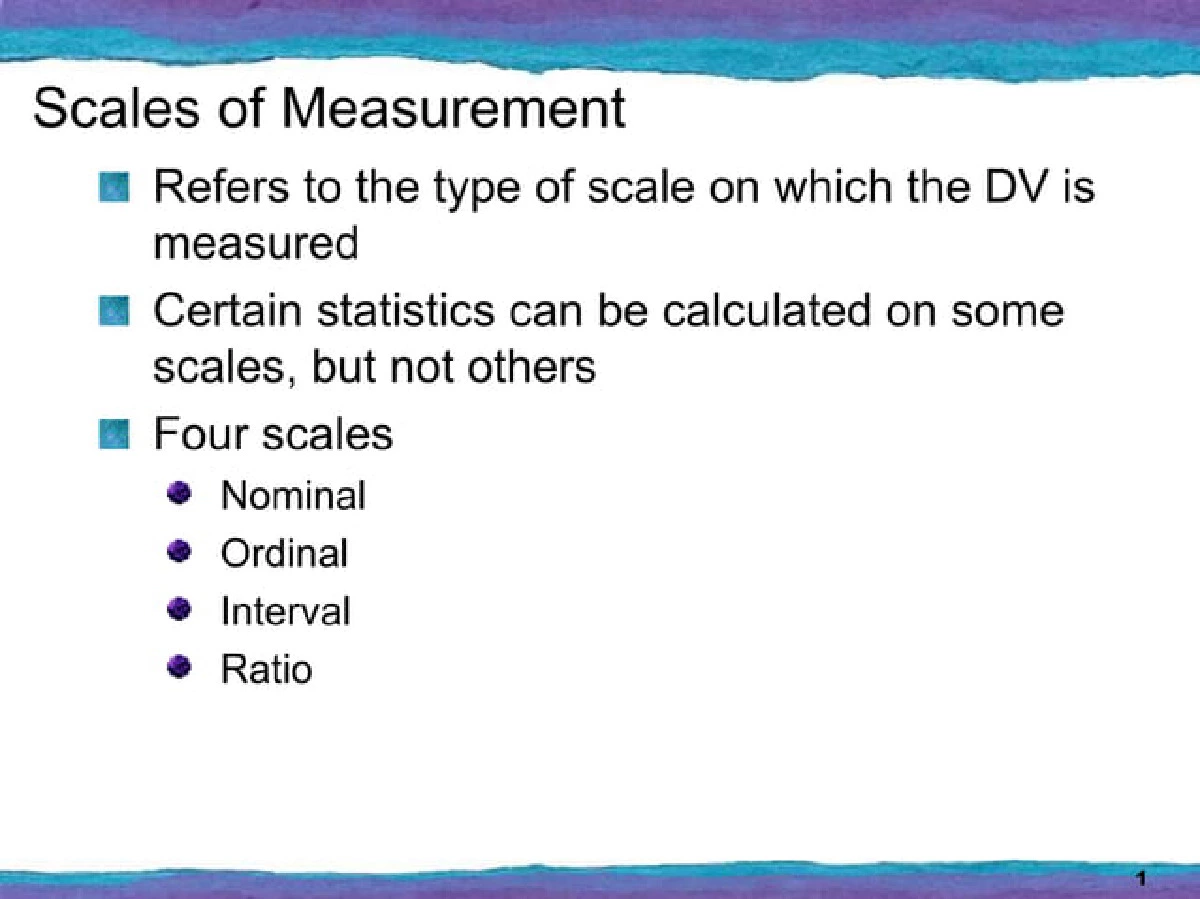
Scales of Measurement in Statistics
Level of measurement or scale of measure is a classification that describes the nature of information within the numbers assigned to variables. Psychologist Stanley Smith Stevens developed the best-known classification with four levels or scales of measurement: nominal, ordinal, interval, and ratio.
Types of Measurement Scales in Statistics with Example
| Scale of Measurement | Description | Example |
|---|---|---|
| Nominal | Categories with no inherent order or ranking. Data are qualitative. | Gender (Male, Female), Eye color (Brown, Blue, Green) |
| Ordinal | Categories with a meaningful order or ranking, but the differences between categories are not uniform. Data are qualitative or quantitative. | Likert scales (e.g., Strongly Agree, Agree, Neutral, Disagree, Strongly Disagree), Educational level (High School, Bachelor’s, Master’s, PhD) |
| Interval | Ordered categories with uniform differences between values, but no true zero point. Data are quantitative. | Temperature (Celsius or Fahrenheit), Calendar dates (month, day) |
| Ratio | Ordered categories with uniform differences between values and a true zero point, where zero indicates the absence of the quantity being measured. Data are quantitative. | Height (in cm), Weight (in kg), Time (in seconds) |
Key Characteristics:
- Nominal: Only equality and inequality comparisons are meaningful.
- Ordinal: Order/ranking is important, but differences between categories may not be consistent.
- Interval: Differences between values are consistent, but there is no meaningful zero point.
- Ratio: Differences between values are consistent, and there is a meaningful zero point.